Exploring test cricket boundary rates in R
September 9, 2018
This past Friday, I was in the pub with a couple of colleagues watching the cricket. As you’d expect for a bunch of people who deal with numbers all day, there’s was a lot discussion of various statistics.
One which stood out as being interesting, but hard to find a stat for online was the proportion of runs which different batsmen have scored from boundaries in their careers.
So I decided to have a look into this on Saturday - here’s what I came up with.
The first step was to try and find some data - there is the cricketr package but this wouldn’t easily allow me to get to all the batsmen who have ever played the game. Luckily, I quickly found a blog post by Duncan Golicher which had some code from scraping the data from ESPNCricinfo which I could re-use for my purpose. Thanks Duncan for sharing your code!
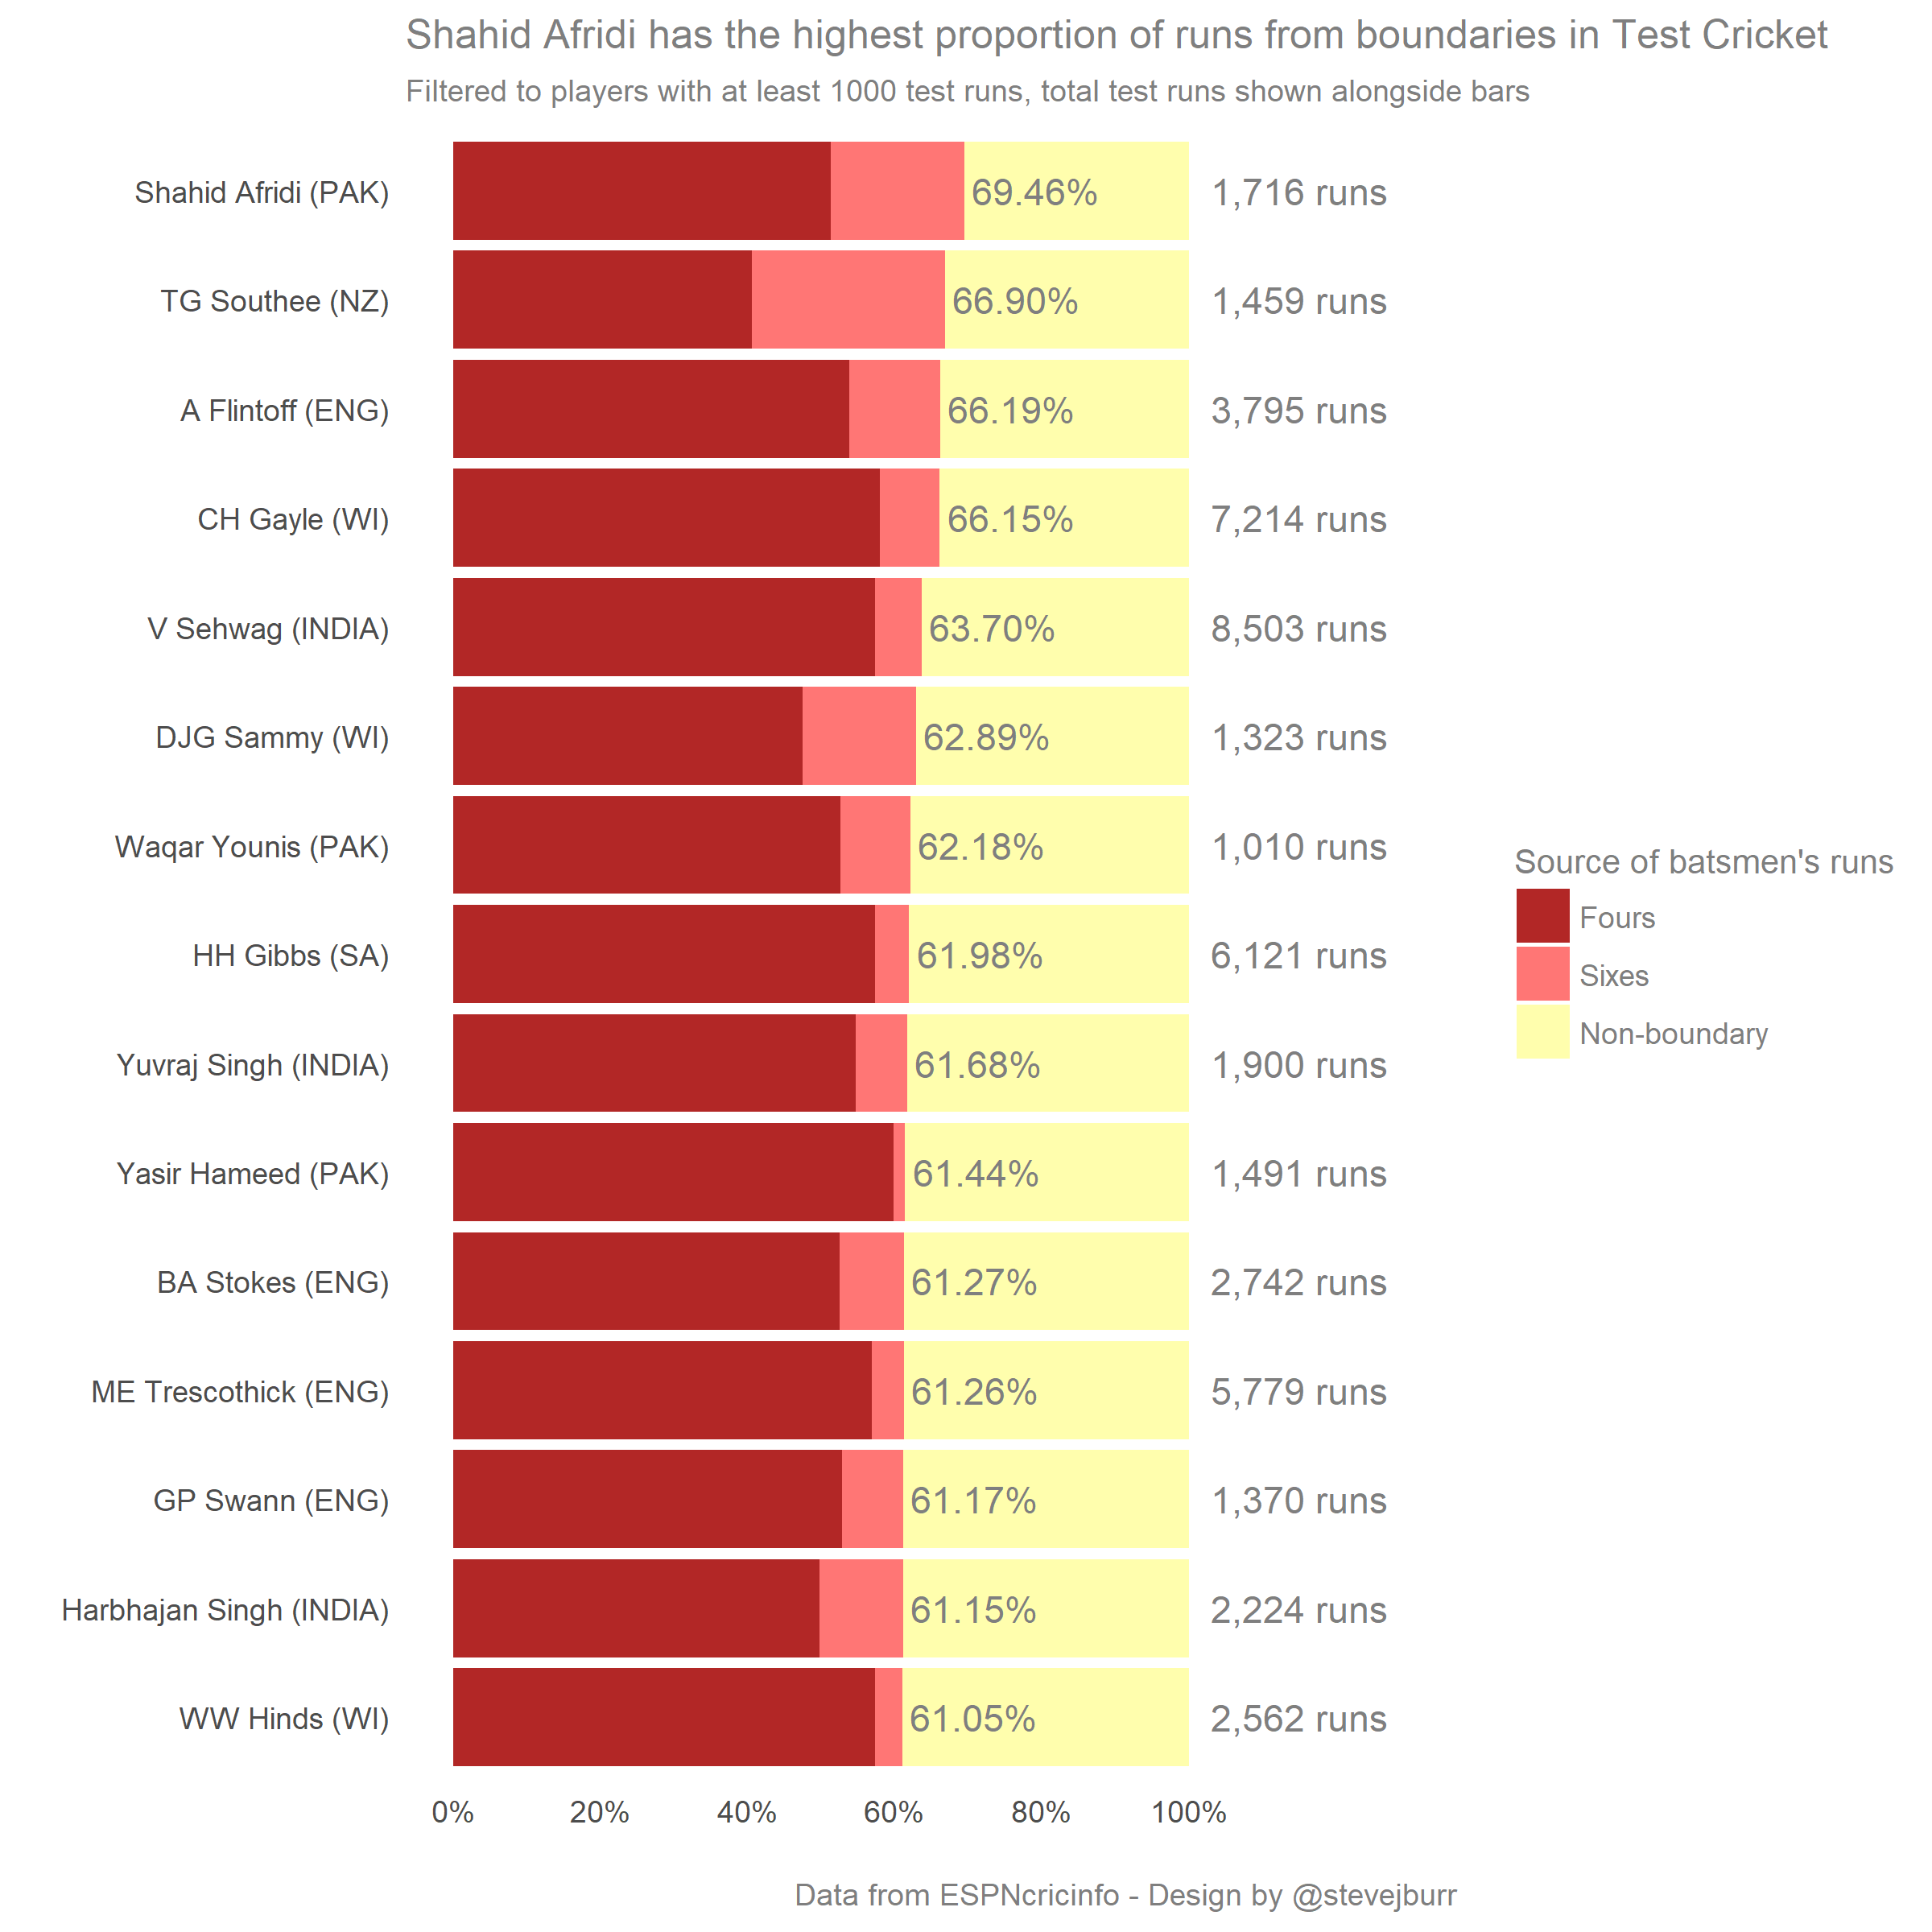
Once I had all the data, I first started looking at the proportion of runs that come from boundaries for each player. We’d already discussed a requirement of at least 1000 test runs to cut out a few short explosive innings from otherwise non-noteworthy batasmen, so I stuck with that requirement.

The names at the top of the list are the sorts that you would expect - players known for big hitting and perhaps more for the shorter form of the game than test matches (particularly Afridi and Gayle).
There are a few more interesting stats further down the list - I wouldn’t have picked out Stokes, Trescothick and Swann as having almost identical boundary proportions.
It did show us that of the current England line up, Ben Stokes hits the most boundaries, though he’s some way short of Flintoff. It puts his slower batting in the current series vs India into perspective!
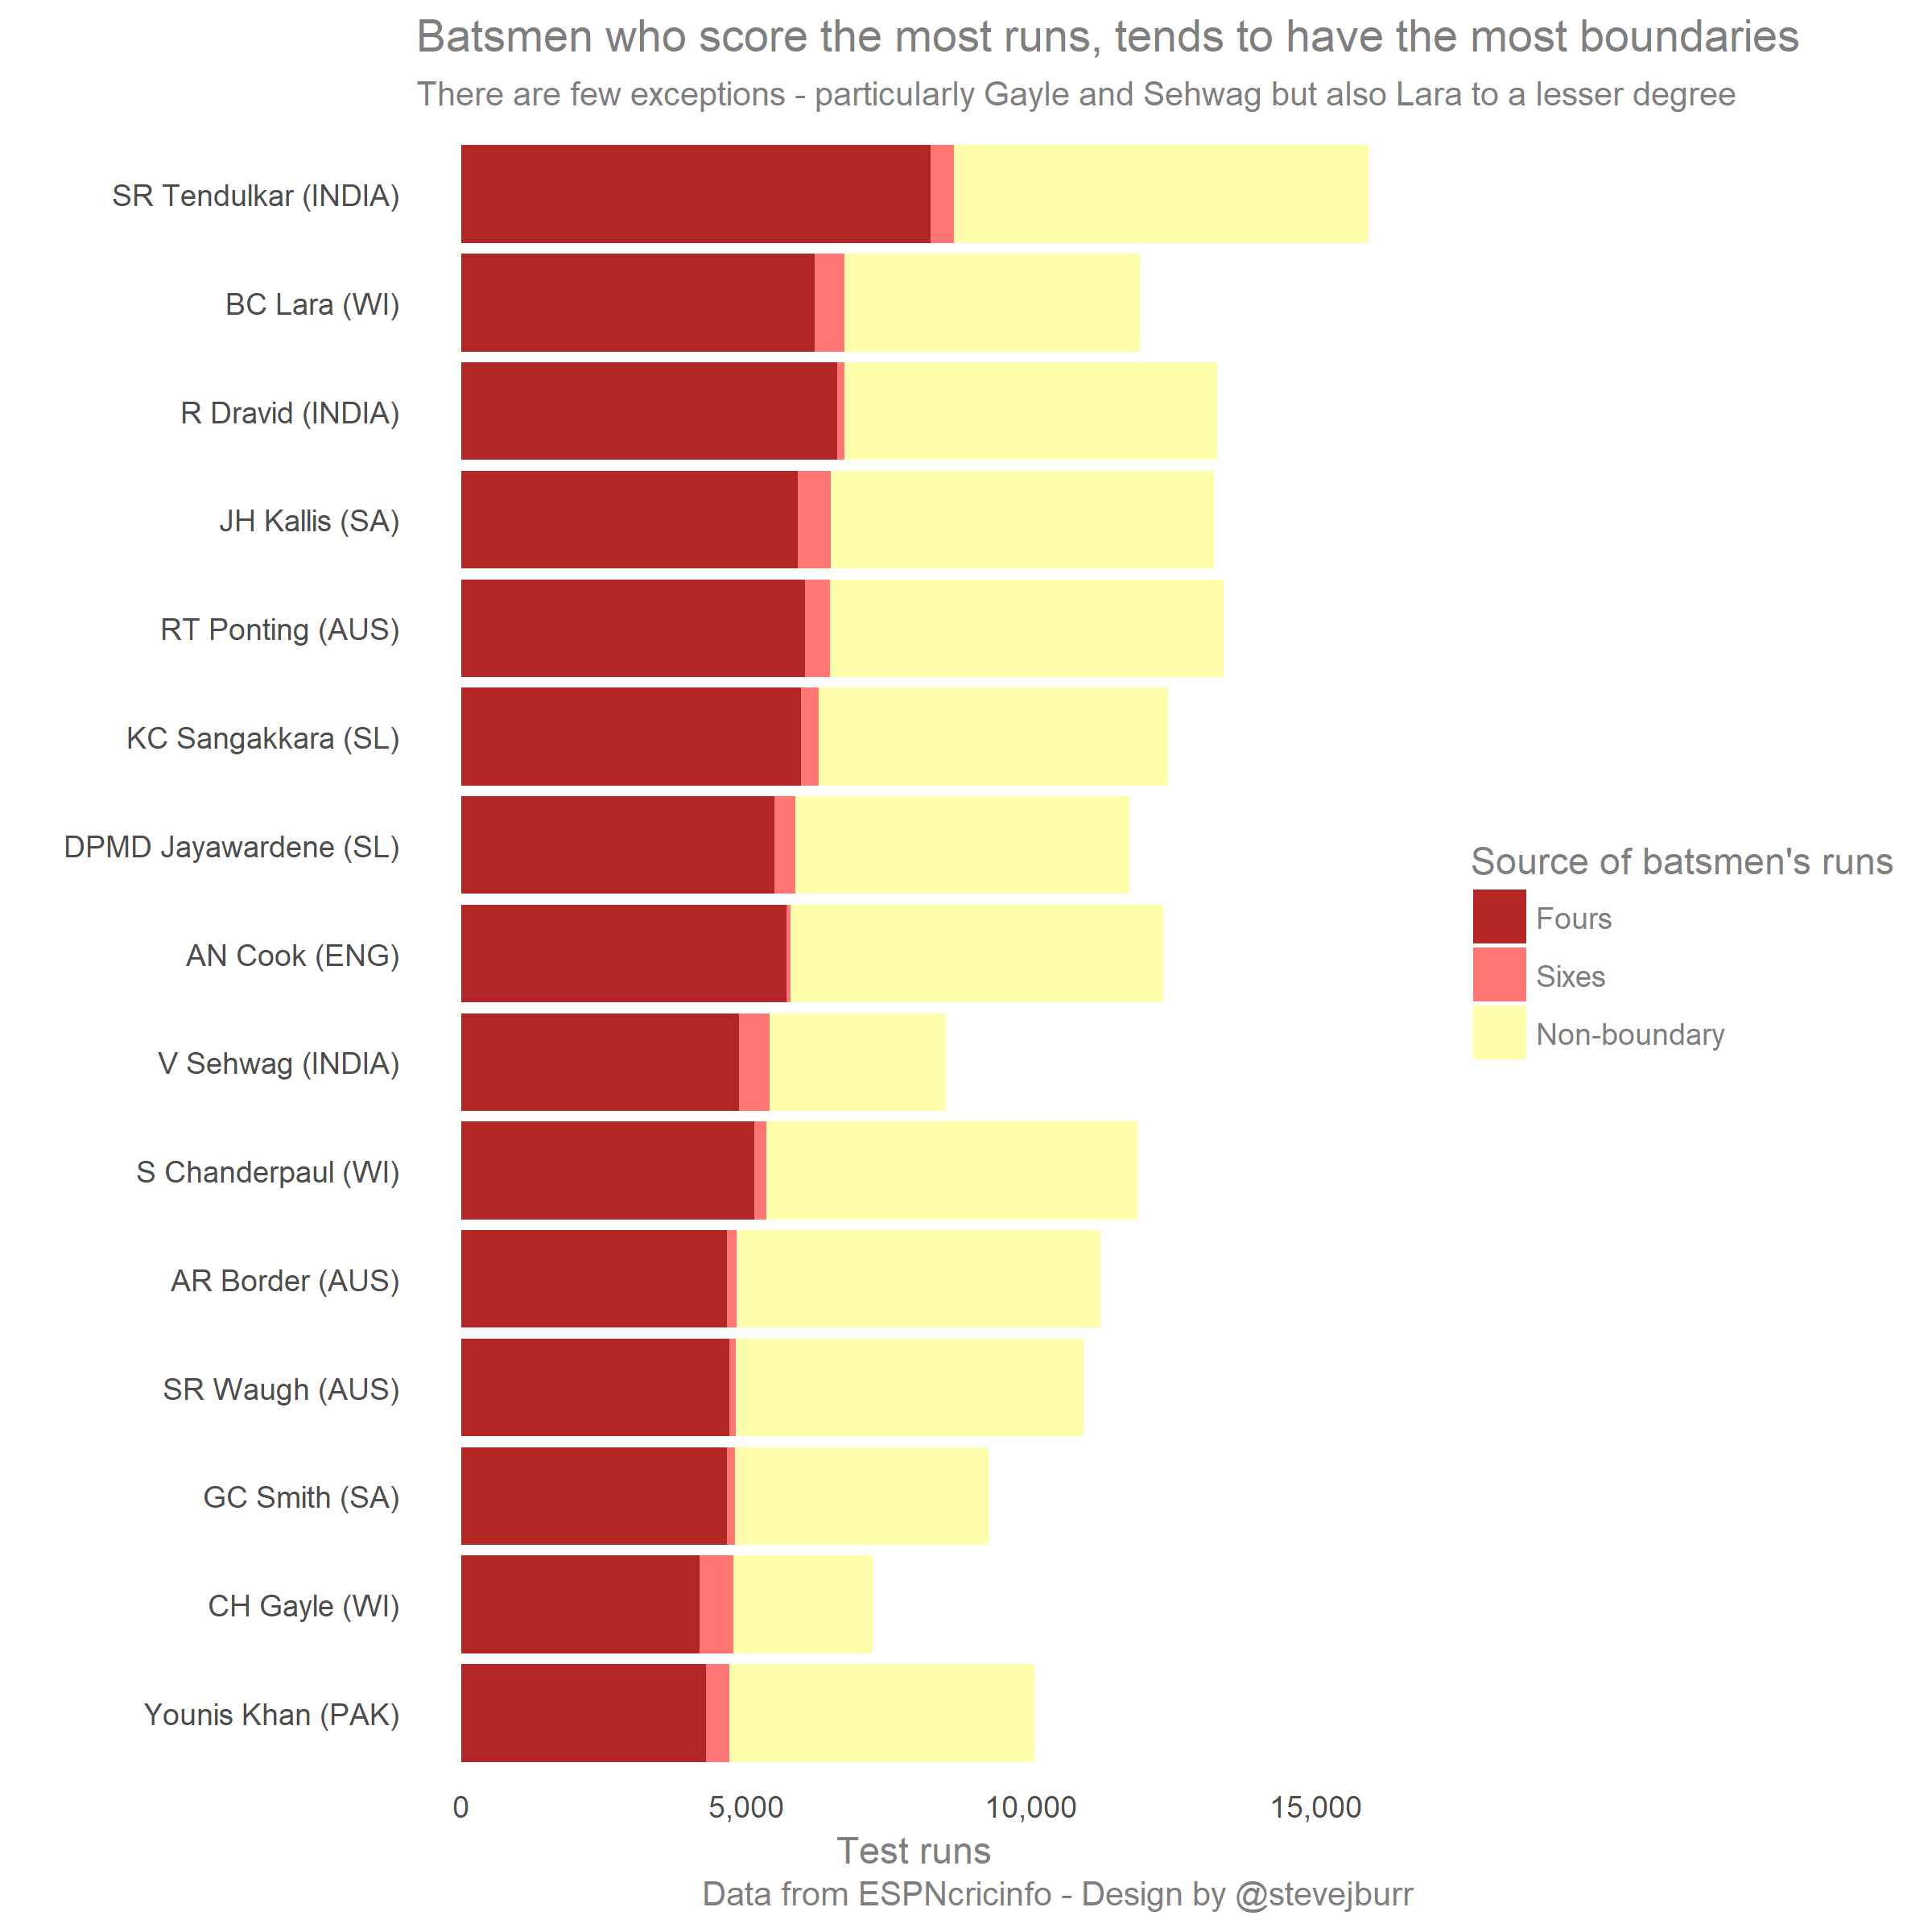
Once I had the data, it seemed a waste to stop at one bit of analysis, so I then took a quick look at those with the most runs from boundaries.

As you’d expect, this is pretty skewed to the highest run scores in Test Cricket. If you look for where the yellow bars take a dip inwards you can see the exceptions - noteably Sehwag and Gayle who were near the top of the previous chart, but also Brian Lara to a lesser degree.
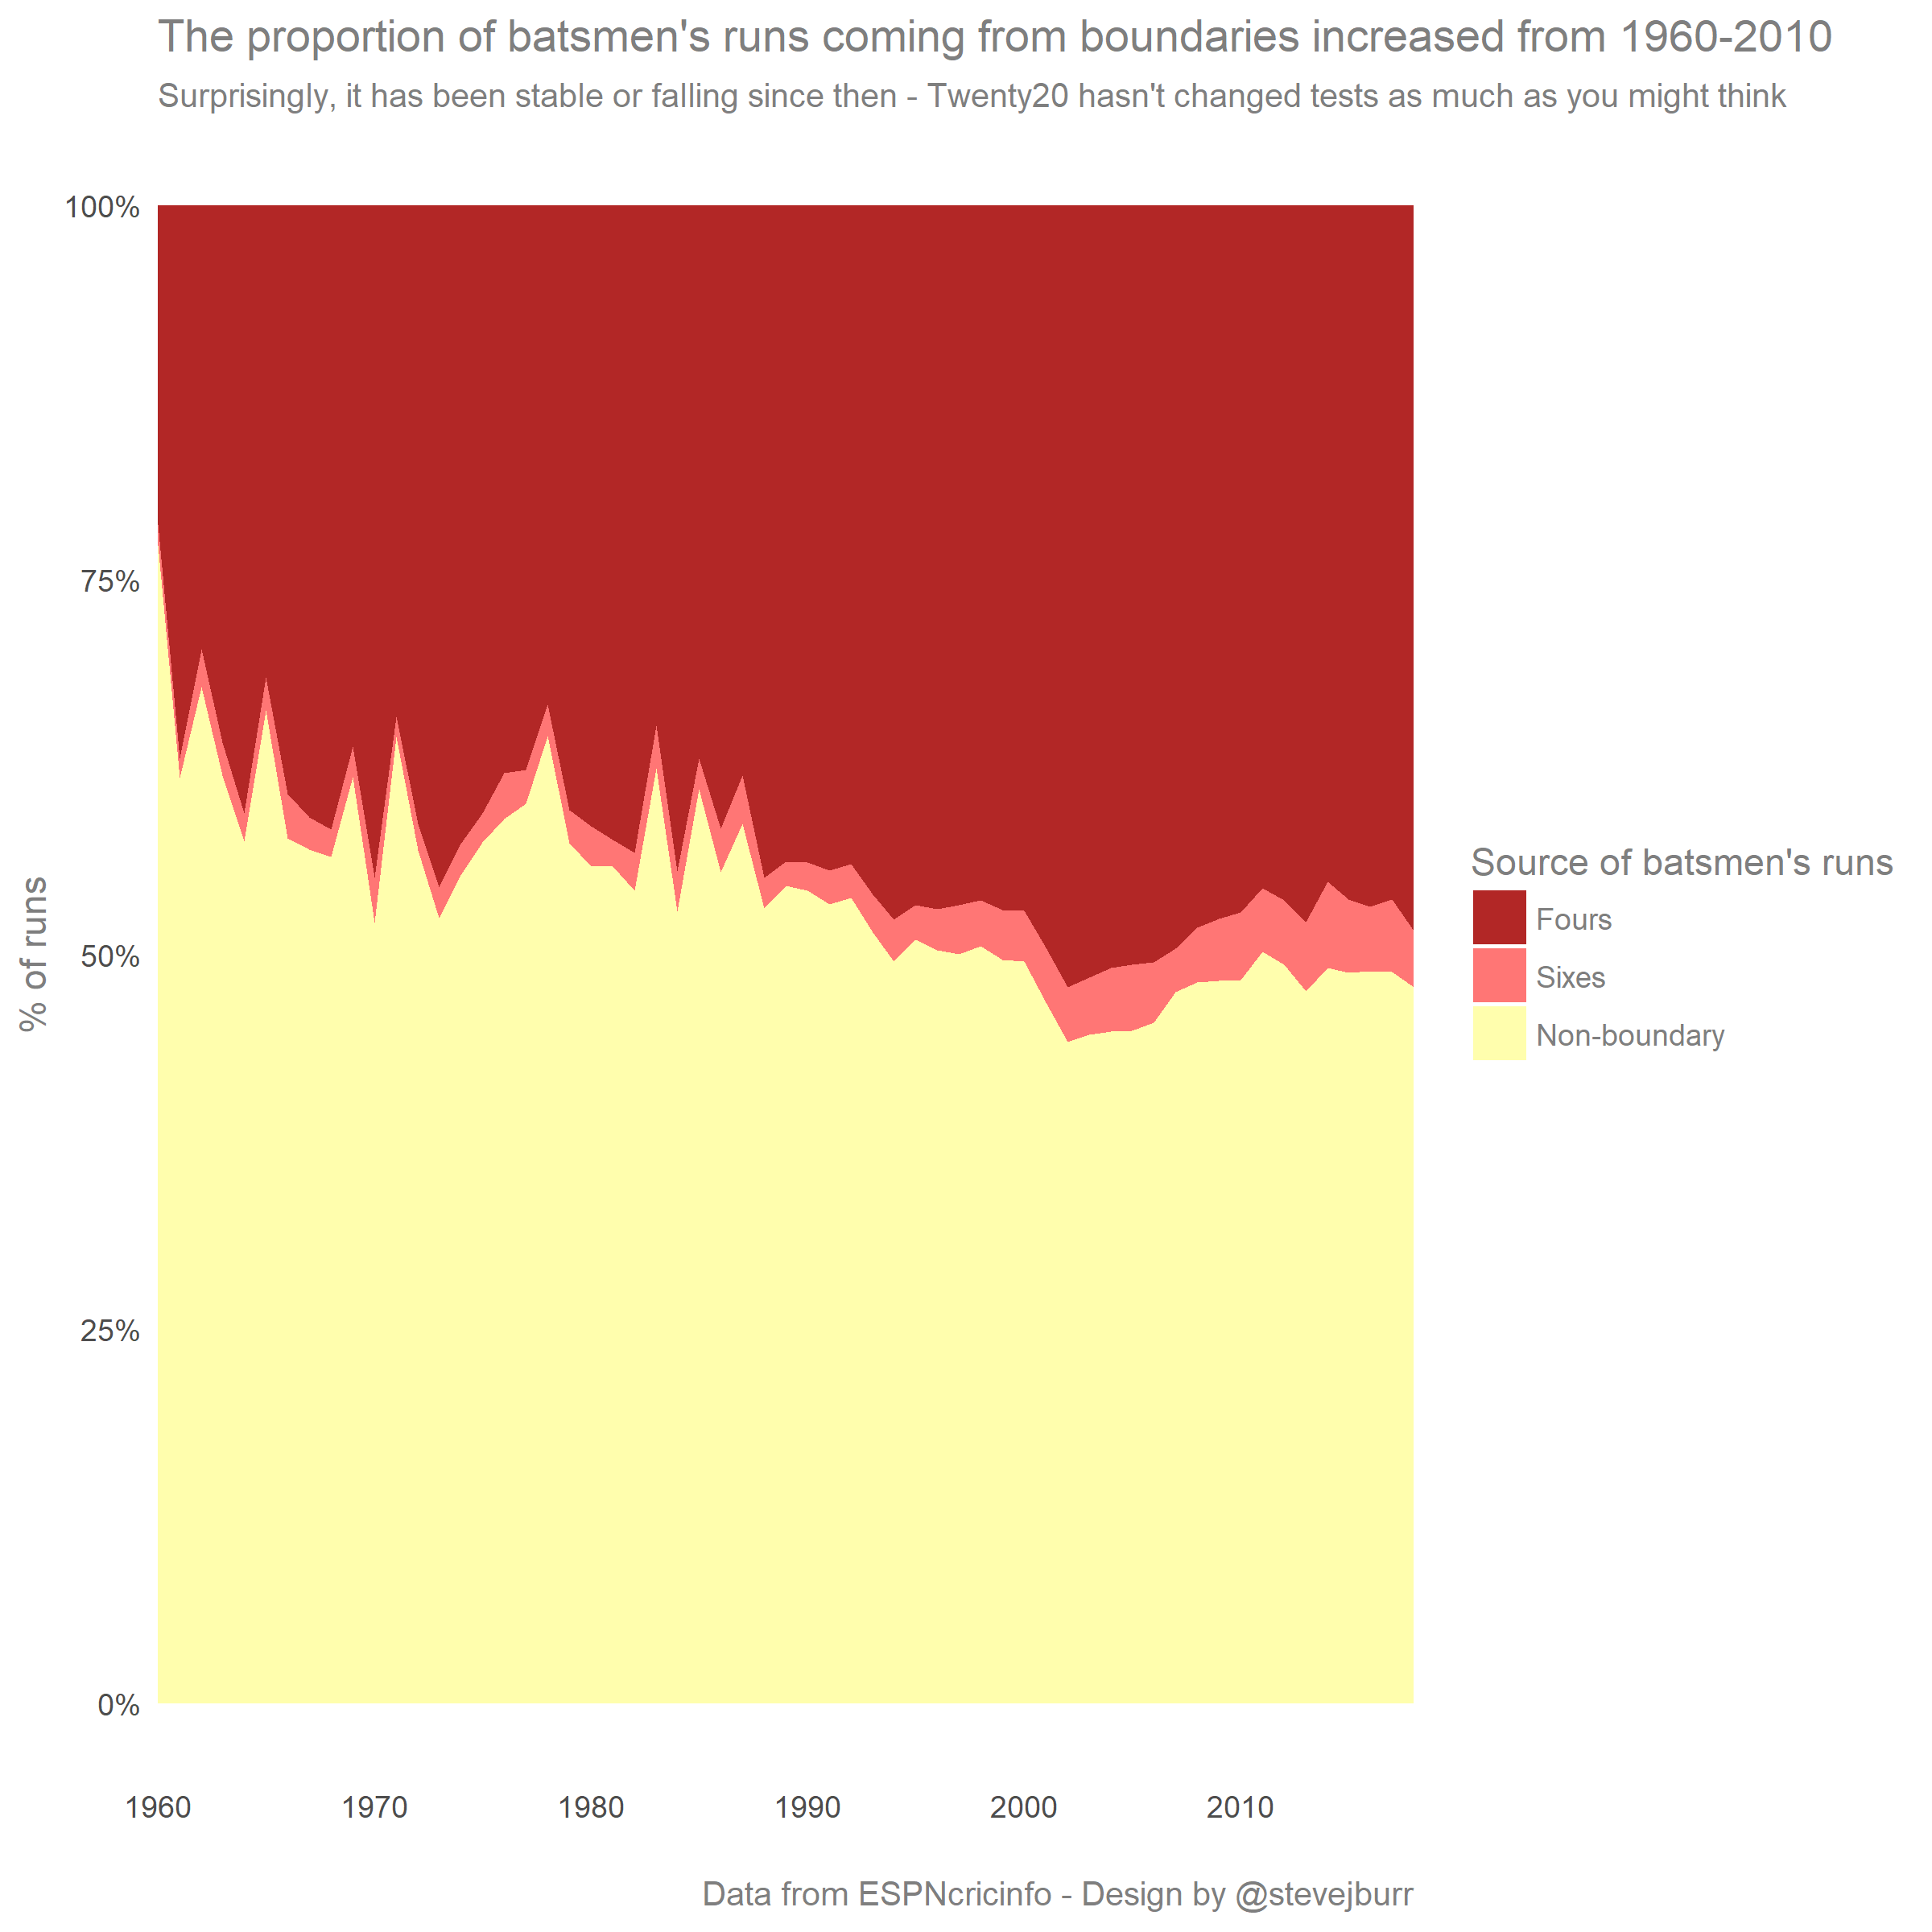
Finally, I thought I’d have a look at how the proportion of batsmen’s runs from boundaries has changed over time. Note, this is calculated from adding up all the individual scores in a year, so doesn’t include extras in anyway. It’s not quite a stat about the proportion of all Test runs by year, but I’d imagine it’s pretty similar.
Cricket commentators often remark on how Twenty20 has changed Test Cricket, and players don’t bat like they used to. So I was expecting a recent uptick in the number of bounaries in Test Cricket.

As you can see, this isn’t what you see in the data. Since Twenty20 came on the scene, the proportion of runs coming from boundaries has fallen, not risen. Obviously this is only one stat, perhaps the key change is actually that people get out more quickly than they used to even if they don’t score more bounaries, or another more subtle change.
Thanks for reading! If you’d like to explore the data more yourself, there’s an interactive Shiny app which I’ve put together here, and the code and data is hosted on GitHub.
If you’d like to discuss this, then find me on Twitter.