MakeoverMonday 5-11-2018
November 11, 2018
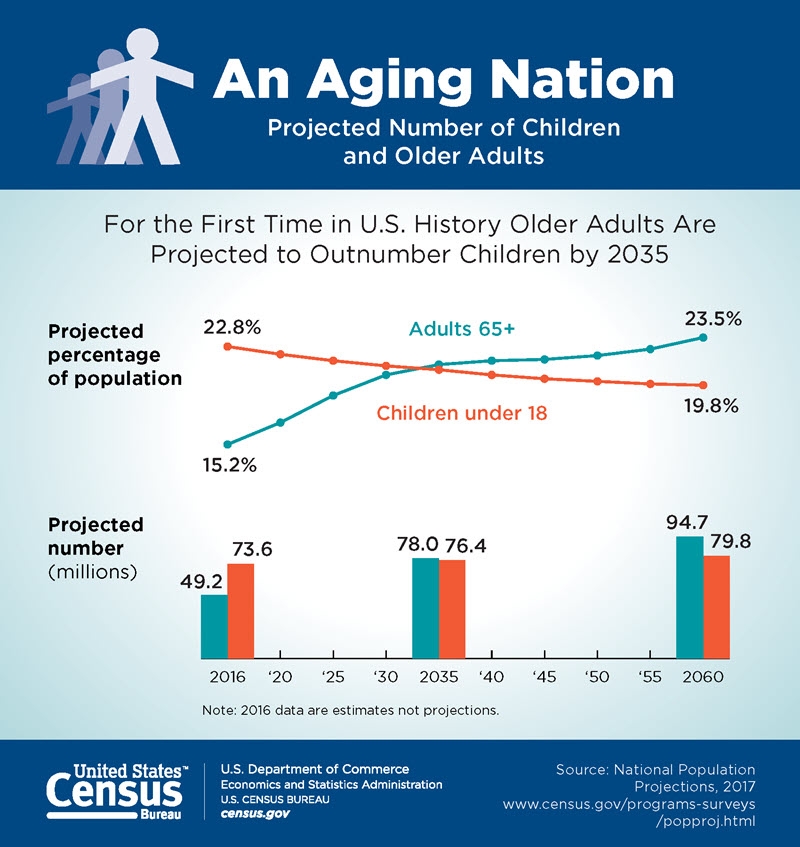
This week #MakeoverMonday was looking at a dataset related to the make up of the US population, specfically at which point will those aged over 65 start to outnumber children aged under 18.
The topic / data is very similar to the one I looked at a couple of weeks back when I was trying to recreate one of Nathan Yau’s visualisations.
Instead of using some of that existing code, I decided to take a fresh look and do something else from scratch. Like last week, I wanted to make sure that I completed my visualisation in under and hour, and I was again successful at doing this though it does place some limits on what’s possible in terms of fine tuning the visualisation.
The original visualisation looks as follows:
What do I like about the original?
- A clear title / takeaway at the top which makes the message of the visual clear.
- Direct labelling of the important data points to make it easy to follow.
- Clear labels of what the two component visualisations are.
- Consistent use of colour across the two visuals and within some of the labels.
What don’t I like about the original?
- There’s too much going on in the header/footer - this may be mandated by the policies of the agency who created the visualisation but these distract from the main content.
- The main heading is a reasonably long sentence so writing it in title case instead of proper case makes it harder to read.
- The bar chart looks really weird - I think it would be better to avoid labelling the missing time periods and having two series next to each other on an axis which is also being used to encode time is a little confusing.
- The gradient in the background is distracting.
I liked how Andy Kriebel showed multiple dimensions of the dataset by showing seperate plots for each combination of gender and ethnic origin in the starting dataset. I decided to use a similar approach as the starting point for my version.
Instead of using line charts to show the change overtime, I decided to use animated bar charts.
There are definite pros and cons to this choice - you can’t work out the crossing points at a glance in the same way as you can with the line chart approach. But animations do seem to do a good job of catching people’s interest compared to static visualisations. Additionally when you have two bars next to each other, you can fairly easily compare their heights to visually understand the relative proportions while directly showing the absolute sizes. In other words, the animated bar chart does the job of both the static line and bar charts from the original visualisation.
I think a line chart approach is probably more useful, especially if someone wants to make multiple comparisons in a non-linear way. For example, you can’t do any easy visual comparison between groups across time in my visualisation because you can only see a single year at a time.
The original data can be found here and my code to produce the animation using R is on Github.