Unexpected Test Cricket Series Results
February 22, 2020
Introduction
I’ve previously used the Elo method to calculate game by game win probabilities for test cricket matches.
More details can be found here.
In that case, I was trying to understand the influence of home advantage on the results of matches. We saw that on average the home team has a +10%pts higher chance of winning than the difference in skill between the teams would expect, and this has been increasing over time.
Test cricket is usually played in series of multiple matches, and not only as one off games. It would be interesting to be able to use the Elo approach, and what we understand about typical home advantage, to work out which historical series results are most surprising.
An Elo Ranking Update
Last time I blogged on this topic in early 2019, my Elo rankings had South Africa and India eveningly matched at the top.
What are the current rankings and how have they changed?
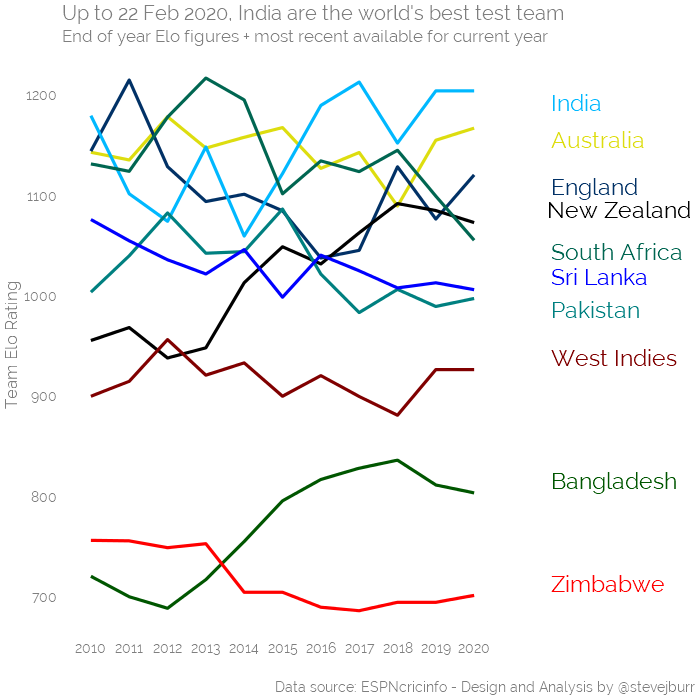
Over the last year, South Africa have fallen down the rankings with England showing a recovery to react 3rd place.
Methodology - Analysing series results
If we want to look at series results, and not just individual games, it makes sense to consider not just the winner of the series but the overall score.
In Test Cricket, it is common for games to be drawn. Using the Elo figures, we can calculate the probability of each side winning a match up based on the difference in Elo, but the equations include the draw probability within these win probabilities. In other words, there is not a direct probability of a drawn game outputted by the Elo equations.
For this post, I’ve decided to use the Elo scores as an input to a model which predicts whether a game will be won, lost or drawn from the perspective of the home team. This also allows home advantage to involved in the calculation, which would also not be captured in a simple Elo based probability of the result.
In this case, I have decided to use a technique called “ordinal logistic regression” to build my results model. This isn’t meant to be an overly technical post, so I won’t go into the full detail of what this means, but more detail can be found here here.
The rough idea of what this technique does is as follows. It is an extension to a simpler technique called logistic regression. Logistic regression is a technique for predicting the probability of a binary (e.g. “win” / “loss”) event. We could build a logistic regression model using Elo scores which would tell us the probility of a team winning game based on their Elo difference vs the competition. This is very similar to what the Elo system itself does, the advantage of modelling would be that we could add further information to our prediction beyond just the difference in skill of the teams. The logistic regression model will give a probability of a team winning the game, we may choose to interpret a probability of >50% of winning as the model predicting a win. We can think of “ordinal logistic regression” as taking that same probability but choosing to interpet it differently when predicting the most likely result. For example, we might say that a probability of <40% of winning is a loss, 40%-60% is a draw and >60% is a win.
By building a win/loss/draw probability for every match, we can then run many simulations of the series (in this case 10,000) to see which results were most likely. If the observed series result does not happen often in our simulations then we say it is an unexpected result.
I mentioned above that by using a model we can account for more than just the underlying strength of the teams, I have decided to also control for the following when calculating win probabilities:
- Home advantage
- The year the test takes place in, as we’ve seen home advantage has changed over time
- The specific two teams involved, and how much better/worse they have played at home/abroad historically (for example, if England lose more often than they should when playing away even after we control for the average home advantage).
The right amount of additional information we include in the model is tricky in this case because we want to use the model to understand what seemed unlikely in the past. If we managed to build a model which perfectly predicted all past results, then it wouldn’t give us any interesting insights as the which results were surprising. Building a perfect model would never be possible, but changing my mind about which variables it is right to include has been part of the reason why it’s taken me a long time to write this post. Ultimately I’ve decided what I’ve done “feels about right” and is it’s only for a bit of fun that’s fine!
This approach isn’t perfect. For one, whether a match is drawn or not does not only depend on the strength of the teams but the weather. A strong team could be close to winning every Test in a series only to draw ever game because two days are lost to rain. Variables like the location and time of year will help to predict this but are not included here.
One final caveat to my simulations is that they are based on pre-series probabilities and do not incorporate Elo changes which happen throughout a series. For example, using the Elo system we would expect the team who wins the first test in a series to have a higher chance of winning the second test after we’ve seen this results than before the series started. This is not incorporated here.
We may be concerned about how accurate the model is. Because we are using simulations to create probabilistic series results, we can evaluate it by comparing the predicted probabilities to the observed probabilities of those events. In other words, if the model says that a team will win the series 30% of the time, we would expect that these teams win about 30% of the time when we look across all the data.
This is known as callibration, we can see that the model is pretty well calibrated, things it sees as unlikely don’t happen very much and things it says should happen normally do:
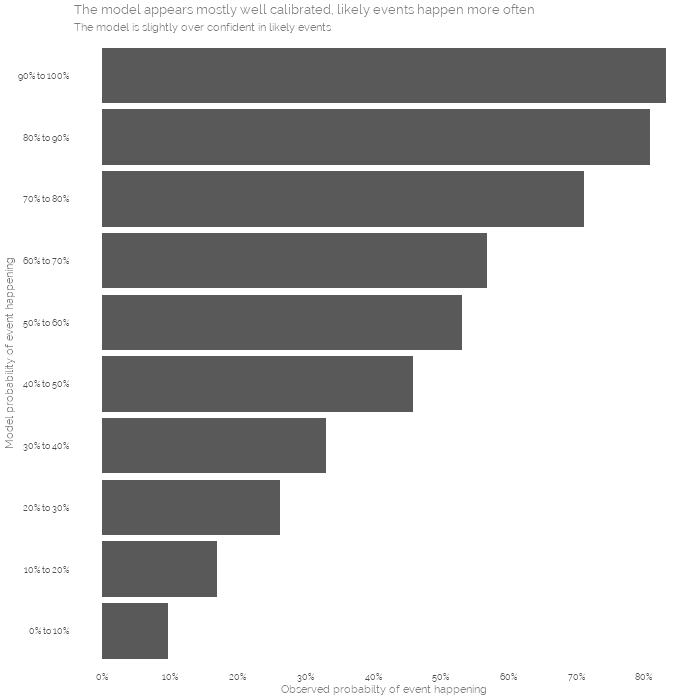
As we are dealing with probabilities and uncertainty, there will always be differences between what we expect to happen and what actually does. Sometimes the underdog wins, it doesn’t mean we were wrong to favour the other team beforehand!
Most unlikey series results:
Let’s use the model to look at the top 10 most unlikely test series results since 1946:
| Most likely simulated result | Probability of this series winner | |
|---|---|---|
| England vs Pakistan 0-3 - 2012 | 2-0 | 4.53% |
| Pakistan vs Sri Lanka 1-2 - 1995 | 2-0 | 4.85% |
| West Indies vs India 0-1 - 1971 | 3-0 | 5.06% |
| England vs India 0-1 - 1971 | 2-0 | 5.17% |
| Australia vs South Africa 1-2 - 2008 | 2-0 | 7.88% |
| Australia vs India 1-2 - 1977 | 2-0 | 9.29% |
| West Indies vs England 2-1 - 2019 | 0-2 | 9.41% |
| West Indies vs England 0-1 - 1968 | 3-1 | 9.61% |
| England vs South Africa 0-1 - 1965 | 2-0 | 10.22% |
| India vs Australia 2-1 - 2001 | 0-2 | 10.32% |
When I started my last post, it was around the time that England were losing to the West Indies in 2019 and this analysis suggest that was the 7th worst series result in test cricket since WW2!
Looking in more detail at some specific test series results
Now we have the model, we can probe into specific test series results to see how unexpected our model thinks the results were.
India in Australia - 2018
India won this series 2-1, which was the first time they had ever won as series in Australia. This was a historic achievement for India. But how good was this result overall?
Well, before the first test my Elo rankings put India as the best team in the world, with Australia only 4th. But when we account for home advantage and the other factors in the model we put Australia as the favourites with a 43% chance of winning the series to India’s 32%.
This suggests India did do very well to win, but this was not amongst the biggest acheivements or upsets we have seen. This Australia team were not as good as their predecessors, the previous time India visitted Australia in 2014 the same model gave Australia a huge 70% chance of victory (they won 2-0).
The 2019 Ashes
The most recent Ashes series was closely matched, featured some amazing moments and ended in a 2-2 series draw.
Going into it Australia were 2nd in the world, with England a fairly distant 4th. Despite this, the model still favoured England giving them a 54% chance of winning the series with a most likely result being a 2-1 England win. This is compared to a 33% chance of an England win ahead of the series they won in 2015 and 2005.
So perhaps England should be disapointed with this result, however a tied series wasn’t that unexpected with this coming up 21% of the time.
England in South Africa
England’s most recent series was their 3-1 win in South Africa. South Africa were highly favoured 54% to 24% to win the series, based on their higher Elo ranking (3rd vs 4th) and home advantage.
That said, England overtook South Africa with this series win and South Africa’s Elo / ranking had been falling since the beginning of 2019, suggesting that the model may have been too confident in their chances.
It’s interesting to see the similar pre-series probabilities for an England Ashes win and a South African victory over England. In both cases, the most likely result didn’t occur but England could arguably be happy with getting a win and a draw out of these two series based on these figures (though the team and fans would definitely prefer them to be the other way around).